
![]()
I have previously written a post about my thoughts on Sarine Technologies and the effect of its revenue and net profit on its roller-coaster share price.
- My thoughts on Sarine Technologies Ltd (SGX: U77) (read here)

As investors, we often take the financial results at ‘face value’, and in my case, I am sometimes too lazy to read more deeply into the reports. Let’s face it, reading annual reports and quarterly reports can be quite daunting and tedious at times.
However, every business is unique and for some companies, there are more to the headline revenue and profit numbers. We just need to spend a wee bit of time and effort checking it out.

In gist, the financial results of Sarine Technologies for FY 2015 and 9M 2017 have been rather ‘disappointing’ when taken into context of its historical financial results. See below.
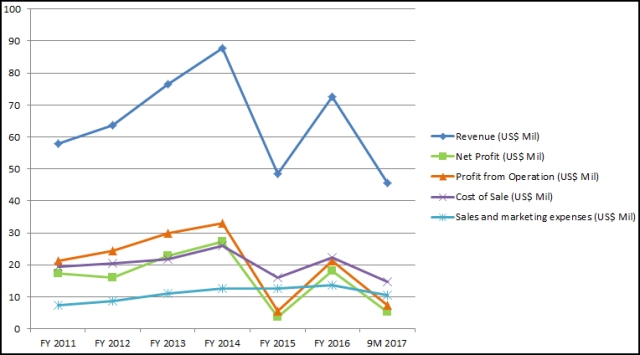
It is easy to see from the above chart that for the 9M 2017 results, the sharp decrease in the profit from the operation has dragged down the revenue and net profit.
As stated by Sarine Technologies (read here), for 9M 2017, the Group recorded a decrease of 15% in revenue to US$45.7 million. The decrease was mainly attributed to lower sales of capital equipment in Q3 2017. Due to the buildup of higher than normal inventories of polished diamonds in the midstream in the third quarter, manufacturers slowed production and reduced capital expenditure.
In the case of FY 2015, as stated by Sarine Technologies (read here), diamond manufacturing activities dropped significantly, by 30- 50%. Overly aggressive rough diamond pricing and stagnant polished diamond prices. Higher than normal polished diamond inventory level at end 2014. The decrease in profitability on a year-over-year basis was primarily due to significantly lower sales due to the challenging industry conditions in FY2015.
Interestingly, the 9M 2017 net profit is already higher than the FY 2015 net profit.
I view the situation of aggressive rough diamond pricing and stagnant polished diamond prices as unsustainable and will eventually correct itself. Being a bottom-up investor, I tend to focus more on the company’s fundamentals rather the macro industry conditions.
- Rough Diamond Bust (read here)
Through new products and services, the company has entered the higher value-add downstream retail segment of the industry, which is more than twice the size of its traditional midstream market and commands higher valuations.
The downstream market is significantly larger than midstream, generating revenues of around US$74bn compared to US$19bn in 2016.
- Sarine Technologies – Edison Investment Research (read here)
The 2 Financial Pillars of Sarine Technologies

1. Strong Balance Sheet
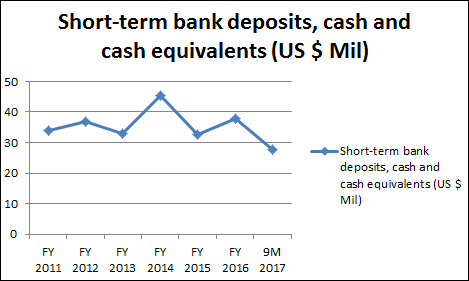
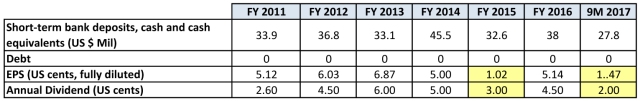
Before I go on, in terms of balance sheet, Sarine Technologies is one of the few listed companies in the SGX with a cash hoard and zero debt.
The cash hoard amount has been fairly consistent.
In most years, the earnings has been more than sufficient to pay for the annual dividend (except for FY 2015 and maybe 2017). There is no need to dip into the cash hoard to issue as a dividend.

Well, the above is fairly obvious.
2. Strong Recurring Revenue
This part is less obvious to some. As stated earlier in the post, I am sometimes distracted by the revenue and net profit announcement and attribute it to lower sales (and perhaps the bigger macro diamond industry conditions).
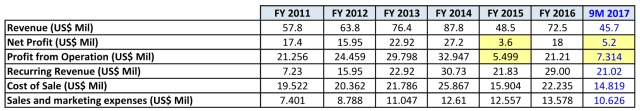
Actually, if we study the recurring revenue of Sarine Technologies, we can see why it is a strength in its own right.
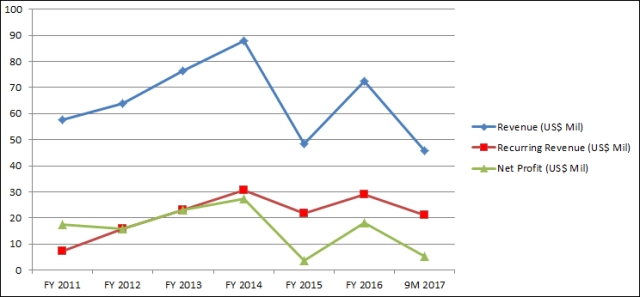
As you can see, even though the revenue and net profit fluctuate higher and lower (blue and green lines), the recurring revenue (in red line) remains fairly constant. True, during bad years such as in FY 2015 (and maybe FY 2017), the recurring revenue also dipped, but basically, it is kind of range bound – hovering between US$20 mil to US$30 mil.
To put it simply, Sarine Technologies’ revenue comes from 2 main components:
- Sale of products
- Maintenance and services
- What Does Sarine Technologies Ltd Do and How Does it Make Money? (read here)
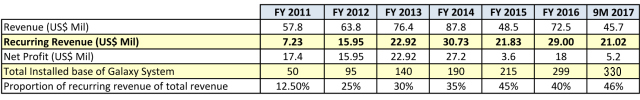
“One of its key products, the Galaxy family, has no competition in the automated inclusion mapping systems market. As of 31 December 2016, Sarine Technologies had a total installed base of 299 systems worldwide. These systems have helped to contribute to Sarine Technologies’ recurring revenue.”
Historically, Sarine’s revenues were entirely driven by equipment sales, which are heavily concentrated in India and were volatile. The company modified its business model to charge usage fees for its products, starting with the launch of the Galaxy family of products in 2009.

Fast forward today, Sarine Technologies is now the dominant player with an estimated 70% global market share in midstream planning and grading equipment.
The relevant product families for planning and optimization are Galaxy, DiaExpert and Advisor software. In addition to selling the equipment, Sarine applies a per-usage charge per carat. A pay-per-use service at a higher price is also available at its services centers in Mumbai, Surat, Ramat-Gan, Antwerp, Moscow, Johannesburg, Gaborone, Windhoek and New York.
Integrated with its planning equipment are its systems for cutting, shaping, polishing and finishing of rough diamonds (Quazer, Strategist, DiaMension and Instructor software). These services are also available as a per-carat service in multiple locations.
Personally, I view recurring revenue as the holy grail of companies’ profit. If a company can somehow have minimal expenditure (once the system is in place), and collect recurring income either via the sales of upgrading software or products, rental fees of equipment, fees from maintenance and services, it will be great.
The business model is scalable. Profitability is maintained or even increased even though revenue (and capacity) increases. This is quite similar to many tech companies which have strong business moats. Which why investors are often willing to pay a premium for their stocks, resulting in high P/E ratios/valuations.
This recurring income is the bread and butter business aspect of Sarine Technologies. While at the same time, Sarine Technologies uses the excess cash for R&D and marketing of new products.
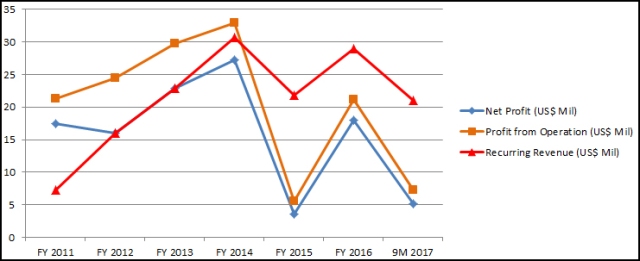
The Recurring Revenue is also fairly ranged bound as compared to the Profit from Operation and Net Profit. Eg, does not fluctuate that wildly.
2014 is an important year. Prior to FY 2014, the Profit from Operation is actually higher than the Recurring Revenue. However, subsequently, the Recurring Revenue figures surpassed the Profit from Operation figures. Without such Recurring Revenue, Net Profit will, without doubt, perform worse.
Theoretically, over time, with an increased base of Galaxy systems, the recurring revenue will do more to help financially.

In addition, during bad times, the company can theoretically tighten on the R&D and marketing expenses of new products and just ‘cruise by’ base on the recurring income. Moreover, Sarine Technologies does not need to worry about debt and liquidity issues. Although this will not be good in the long term and I don’t think Sarine Technologies is doing that. However, it is totally possible.
The recurring revenue is a significant portion of Sarine Technologies’s total revenue. In 9M 2017, the recurring revenue alone is 46% of the total revenue. Not surprisingly, during bad years when there are significantly lower sales due to the challenging industry conditions, the percentage of this recurring revenue in the total revenue increases. As stated in Sarine Technologies 9M 2017 report (read here): “Nevertheless, the Group did not experience any significant drop in the number of stones processed by its installed base. Recurring revenues remained stable and accounted for over 46% of Group revenue.”
In many of the companies I invest (or have invested in before), I tend to like businesses with recurring income. Eg. Vicom, IsoTeam, Colex, Fu Shou Yuan…
Perhaps this is why many investors like investing in REITs or Healthcare stocks. There is this recurring aspect of the business which is less cyclical and less dependent on macroeconomic conditions.

Threats
Nevertheless, there are threats to the Sarine Technologies recurring revenue. As mentioned earlier, the Galaxy family systems have helped to contribute to Sarine Technologies’ recurring revenue.
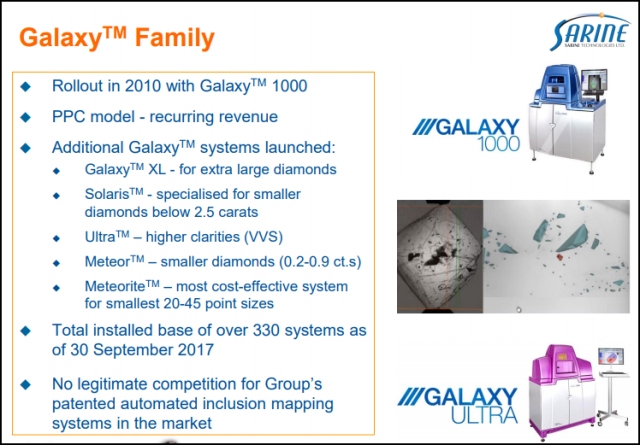
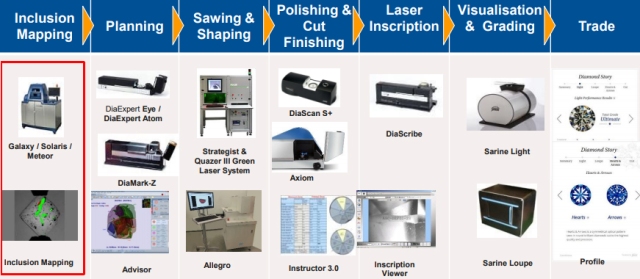
The total installed base of Galaxy System has been steadily increasing over the years. And currently, there is no legitimate competition for the Group’s automated inclusion mapping systems in the market.

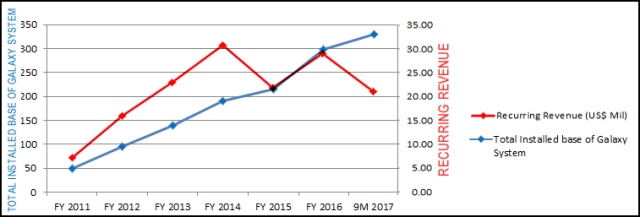
Oddly, despite the above mentioned, it is observed that the recurring revenue has been range bound, or more specifically, did not continue upwards after FY 2014. It could be due to the bad macro diamond industry conditions during those periods. However, it could also be due to the fraudulent use of Sarnie Technologies Galaxy® inclusion mapping technology and systems by manufacturers.
Nevertheless, Sarine Technologies have been active in their legal efforts against these technology infringers. So far, the related news has been encouraging.
- Sarine Thwarts Customer’s Fraudulent Use of Galaxy (read here)
- Sarine Technologies Group Continuing Legal Efforts Against Technology Infringers (read here)
- Sarine to sue overseas manufacturer for fraudulent misuse of Galaxy system (read here)
- Israeli firm sues diamond companies over software ‘piracy’ (read here)

In addition, Sarine Technologies has started expanding their recurring revenue base, through increasing market penetration for sales programs utilizing the Sarine Profile. This is to target the polished diamond retail-related segment. So it is not just recurring revenue from the downstream portion but also upstream portion of the industry.
- Your guide to choosing the perfect diamond the 21st century way (read here)


Thank you, excellent and helpful analysis.
Below my thoughts:
++ Rec Revenue % of Total Revenue increases in line with installed base. Once it reaches a level of 60 to 65%, say in about 3-4 years’ time, Sarine will be able to cover its fixed costs from Rec Rev margins and so stabilize its profitability,
— On the negative side, the company’s business is clearly cyclical with EPS not exceeding 6.87cts at the peak of the cycle, corresponding to a current PER of 16.7. Add to that the still unresolved issue of “piracy” and I would have difficulty to see the share going further up.
— If Sarine’s product is as unique as they claim (“no legitimate competition”) then they have clearly not done enough to protect it from piracy (patent registrations, software controls, …). I spent 37 years in the software industry and such phenomena are very rare nowadays.
Discl: Invested @1.10 $
LikeLike
Thanks for sharing. With regards to the issue of ‘piracy’, it could be a case of being too lax with no patent / protection like you mentioned. Hence other software, eg. ‘Mandakini-Work Manager’, was able to duplicate its function.
LikeLike
Great summary, thank you! You can go one step further and analyse the implication of steady recurring portion against decline in overall sales. I.e. What does is tell us about the overall industry health and Sarine’s position, when the recurring portion in the sales mix is actually not declining despite slow growth in machine sales and then relate it to current cycle and the piracy issue? Also take into account that Sarine has complete transparency over where which stone is scanned. The general Indian unorganized-to-organized story might be at work here. You can also look at earlier years when the company did not have a recurring model to get a feeling for the mentioned downside protection. Similar economics will further apply for the certification and retail sides of the new business ventures. You can then reason about implication for future valuation as the business becomes more and more recurring and therefore less risky.
LikeLike
Just a little add-on to the piracy discussion. I think it is helpful to understand a) what is actually copied and b) who is likely to buy a pirated version (for whom is such an offer interesting? How do the buyers economics play out?). If you contrast that with the structure of the industry in India and Sarine’s counter measures, you should be able to get a sense for the size and impact of the problem.
LikeLike
Mario, thanks for the thoughtful feedback. Good starting point for my future reading when time permits.
As for the macro part (buyers economics, structure of the industry in India), that is something which is maybe too broad.
Looking at the past historical data of Sarine is a good starting point, when the recurring model is not prevalent, and about implication for future valuation as the business becomes more and more recurring and therefore less risky.
LikeLike
Pingback: The Curious Case of Sarine Technologies Ltd (SGX: U77) | A Pen Quotes
Pingback: The Curious Case of Sarine Technologies Ltd (SGX: U77) | TheFinance.sg