Crash in year 2015? Well it will eventually crash, don’t know when. If it did, and if you are looking at a sea of red in your portfolio, what would you be thinking? To sell? To buy ? To hold? If it is the latter… then why, why hold? Or probably why did I buy this stock in the first place?
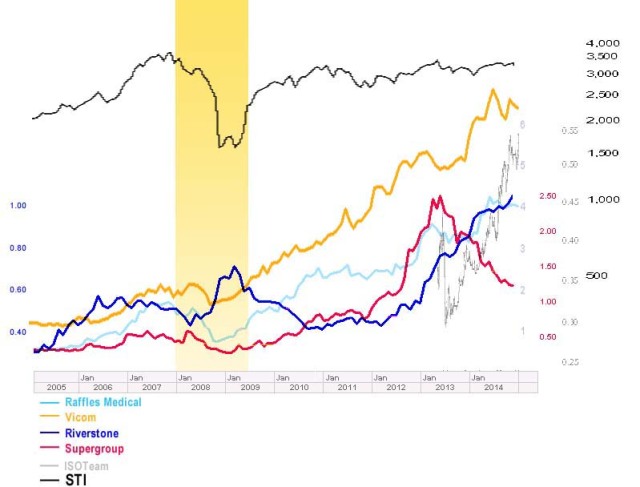
Just wondering, how did these stocks perform during the 2007 crash (see below)?
Any point I want to make about the above chart? Nope. All of these stocks fell after Dec 2007 (not much impact on Riverstone during that period though). Yup, if there is a market crash, they will probably drop.
You can’t see the future through a rearview mirror. Peter Lynch.
“Forecasts may tell you a great deal about the forecaster; they tell you nothing about the future.” Buffett.
I have previously did a short analysis of the above mentioned stocks (click here). Let’s go a little bit deeper.
It is noted that ROE (Return on Equity) is an important factor to consider. Buffett, for example, has targeted companies that have averaged an ROE of at least 15% over the past decade. Well I don’t really have that 10 year data on hand now (let’s make do with approx. 5 years). It appears that all of them have high ROE.
Peter Lynch, John Neff, and James O’Shaughnessy, have incorporated dividend yield into their strategies in various ways. So let us have a look their dividend yield. Ideally dividend yield is to be at least 4%. Only Supergroup come close to it.
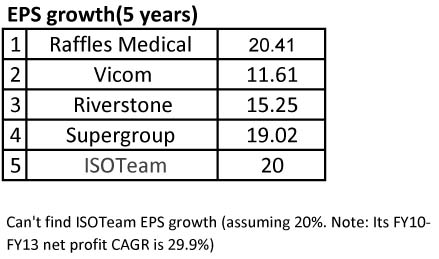
Let’s do a quick calculation on their intrinsic value. First let’s look at their 5 years earning growth (obtained from ft.com, except for ISOTeam).
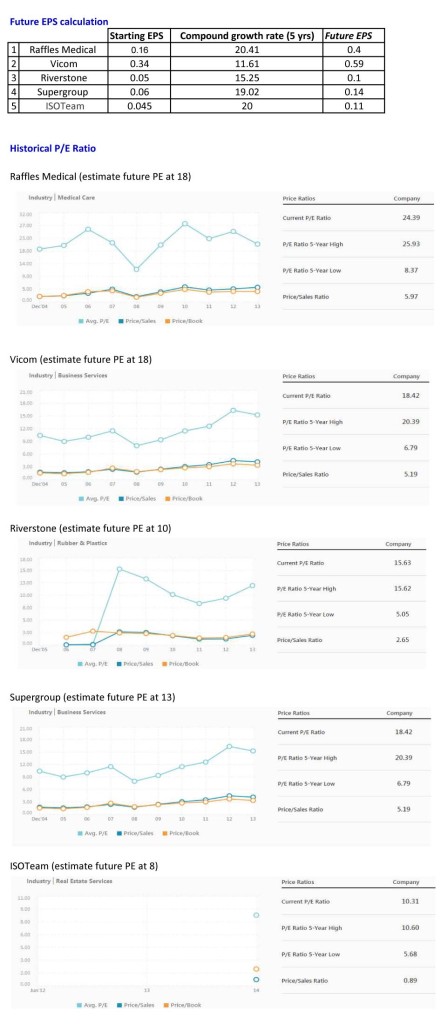
We are going to use a timeframe of 5 years from now for this purpose. Given EPS and a PE ratio, stock price can easily be calculated for any company. Using the below formula. (actually I just got the results after keying in the figures in this website :P)
F = P(1+R)N
where:
- F = the future EPS
- P = the starting (present) EPS
- R = compound growth rate
- N = number of years in the future (5)
Estimated future EPS and PE as per below:
See below for calculated intrinsic value of each stock vs current stock price.

Looking at the above, for all, their current stock price is above the calculated intrinsic value. And the greatest difference appears to be with Riverstone. Raffles Medical stock price is quite near to its intrinsic value.
However, all these are not an exact science (esp. with my estimation of future P/E). Future events may change the fundamentals of the companies – cash flow change, management changes etc. Well but at the very least, for the moment it satisfies my curiosity.
“Risk comes from not knowing what you’re doing” Warren Buffett


Pingback: Earnings and Riverstone | apenquotes
Pingback: Super Group | apenquotes
Pingback: Riverstone Holdings Limited (The one that got away) | A Pen Quotes
Pingback: Rock Solid Shares – where are they now? | A Pen Quotes
Pingback: Super Group – change for the better? | A Pen Quotes