

In my previous post, the blogger from Createwealth8888, highlighted that I should look at dividend yield and dividend payout ratio as a pair, and not that many investment bloggers mentioned it.
And rightly so.
High dividend yield is desirable to shareholders. However, low payout ratios can be good too. Low payouts can mean the company is growing rapidly and has the potential for high total returns. Well, I always have a suspicion on stocks with high dividend yield and on their ability to maintain such high yield (looks too good to be true at times).

For income-oriented investors, the dividend payout ratio is a closely-watched financial measure. Dividend payout ratios provide valuable insight into a company’s dividend policy and can also reveal whether those payments appear “safe” or are in jeopardy of possibly being reduced.
An excessively high payout ratio suggests that the company might be paying out more than it can comfortably afford. Not only does this leave just a small percentage of profits to plow back into the business, but it also leaves the firm highly susceptible to a decline in future dividend payments. In some cases, a company will even pay out more than it earns, thus yielding a dividend payout ratio in excess of 100%. Such extremely high payouts are rarely sustainable and should warn investors that a dividend cut may be on the horizon. Because the act of reducing dividends is usually interpreted as a sign of weakness, when a dividend cut announcement is made, it also usually triggers a decline in the share price. (Read here).
The dividend payout ratio is a relatively simple calculation: Total Annual Dividends Per Share / Diluted Earnings Per Share
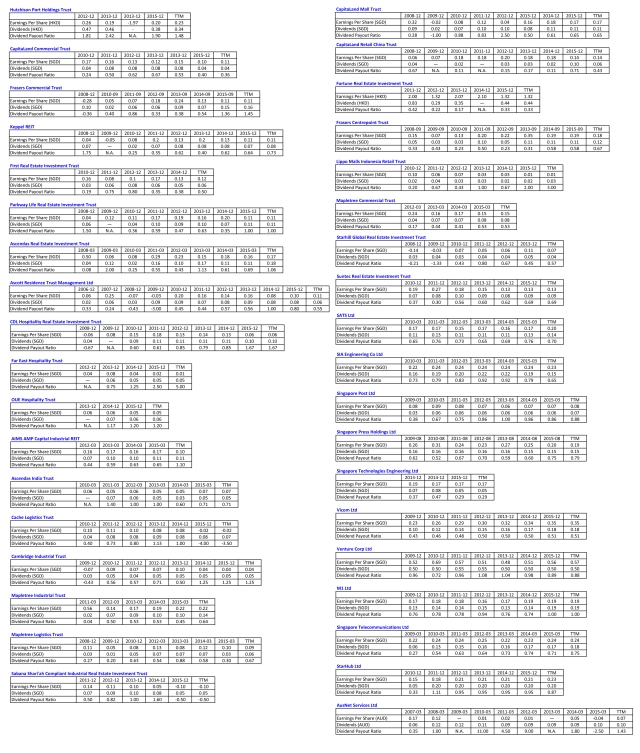
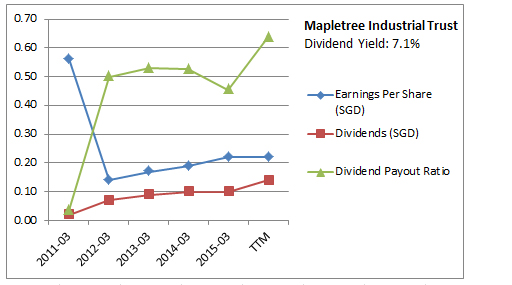
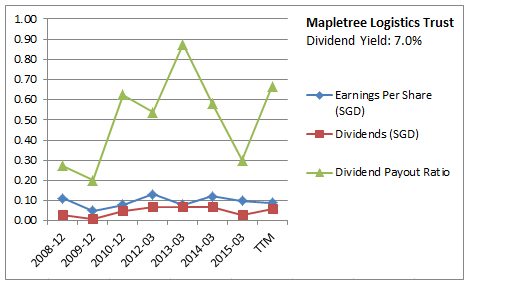
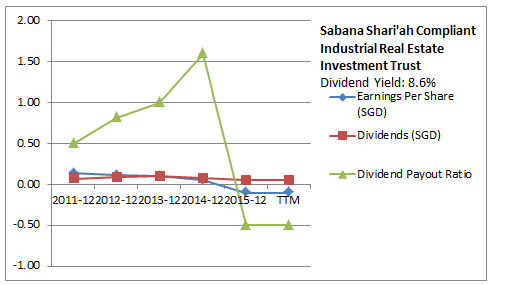
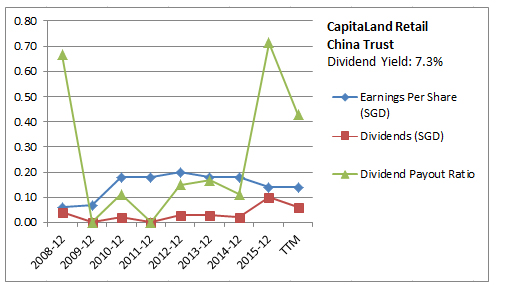
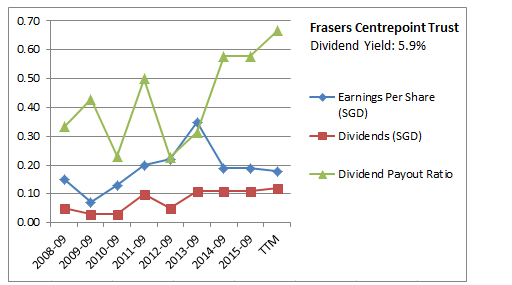
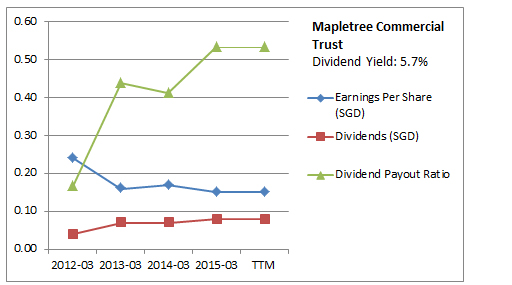
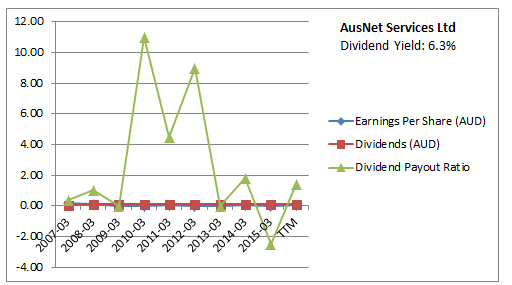
I have created a list of the annual Earnings Per Share, Dividend and Dividend Payout Ratio for the list of stocks (REITS, Trust, Utility, Telcos stocks, etc) as shown in the High Yield Dividend Stocks list from Investment Moat (click here).
I obtained the yearly earnings per share and dividend values from Morningstar. Next, I divide the dividend by the earning per share value to get the dividend payout ratio values.
I did not capture all the stocks listed there as some of these stocks are newly listed (eg. IREIT, Viva, Soilbuild, etc) and they lack the historical data required (I typically look for min 4 to 5 years of data).
In addition, I tried to start from the year, the stock first started paying dividend. There are years at the beginning when there were no dividend issued.
Please see tables and charts below.
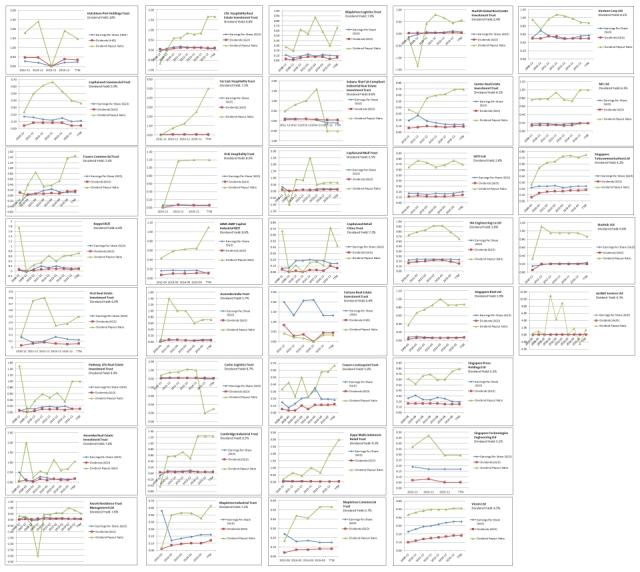
See below for individual charts.


Ok, so what I am looking for with all these data?
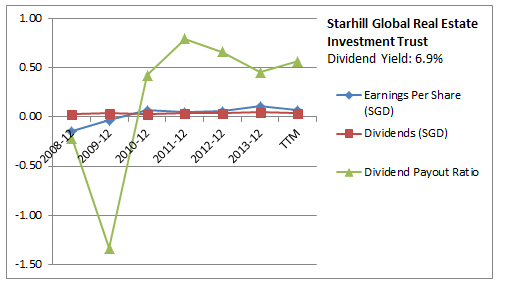
Well, first of all, I am looking for consistent dividend, and better yet, dividend growth.

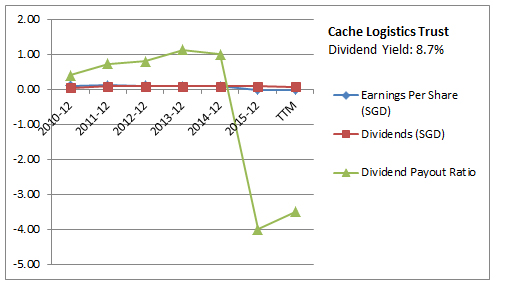
Next, I am looking for consistent dividend payout ratio, and better yet, decreasing dividend payout ratio (or the very least a gradual increasing dividend payout ratio). Having said that, a negative dividend payout ratio is not desirable. As this would probably mean a negative earning per share.

Looking at the charts, the following stocks would stand out:
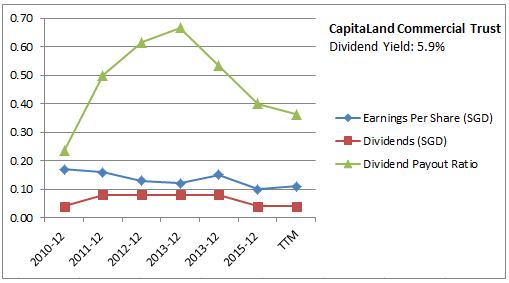
- CapitaLand Commercial Trust
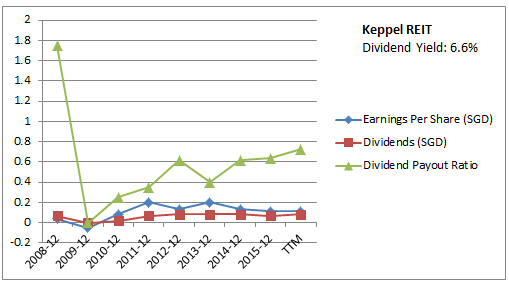
- Keppel REIT
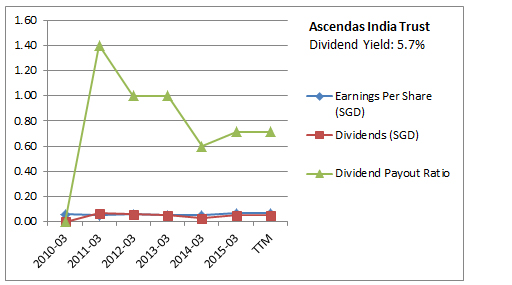
- Ascendas India Trust
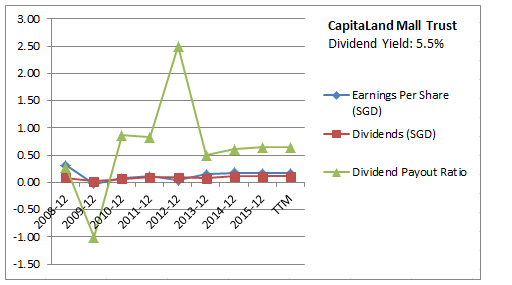
- CapitaLand Mall Trust
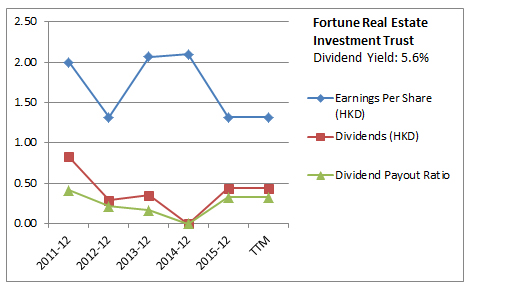
- Fortune Real Estate Investment Trust
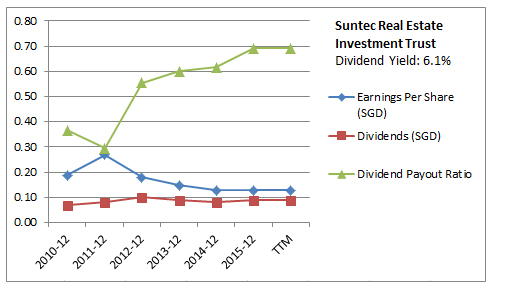
- Suntec Real Estate Investment Trust
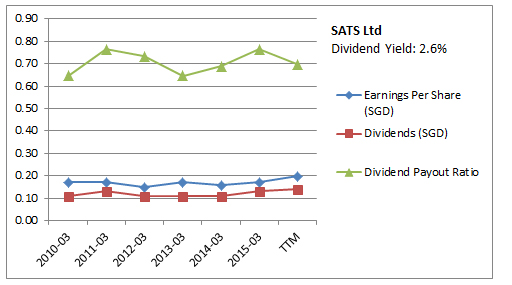
- SATS Ltd
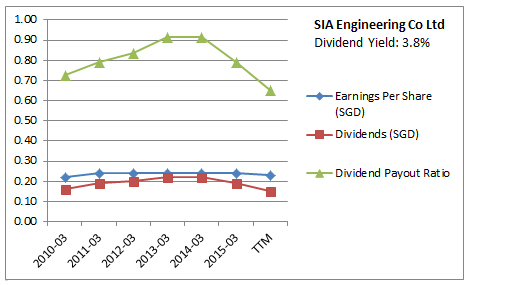
- SIA Engineering Co Ltd
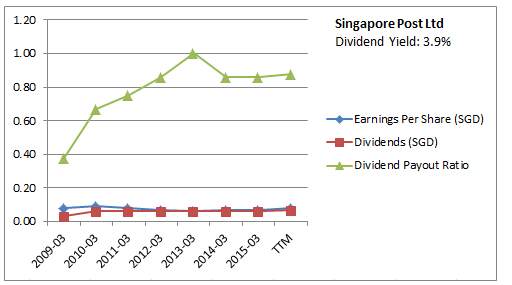
- Singapore Post Ltd
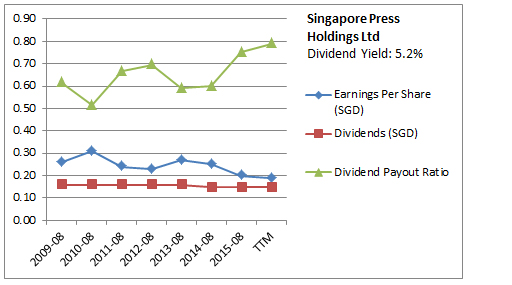
- Singapore Press Holdings Ltd
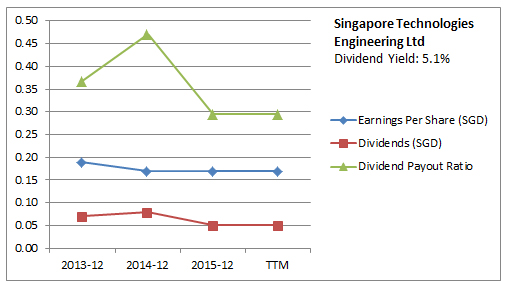
- Singapore Technologies Engineering Ltd
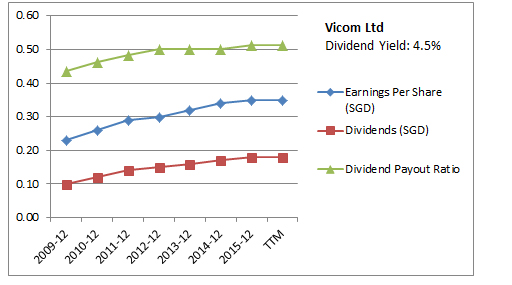
- Vicom Ltd
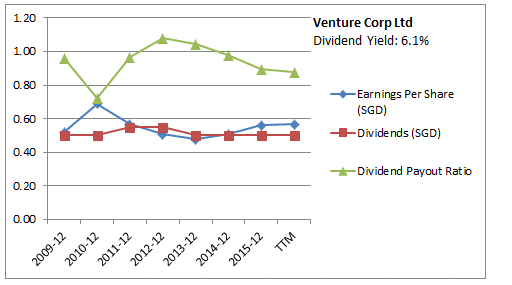
- Venture Corp Ltd
- M1 Ltd
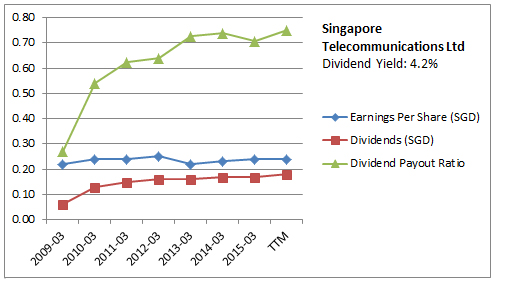
- Singapore Telecommunications Ltd
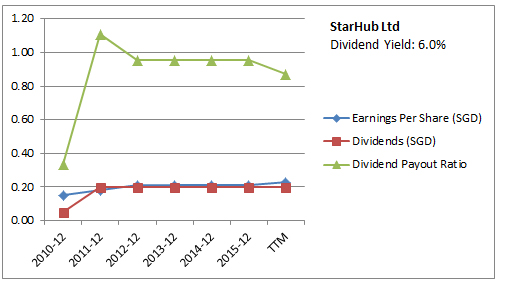
- StarHub Ltd
However, beside looking at the trend, we should also consider the value of the dividend payout ratio itself. eg. looking for low dividend payout ratio. After all, as mentioned in the article above: “An excessively high payout ratio suggests that the company might be paying out more than it can comfortably afford.”

- CapitaLand Commercial Trust (Latest payout ratio: 0.36)
- Keppel REIT (Latest payout ratio: 0.73)
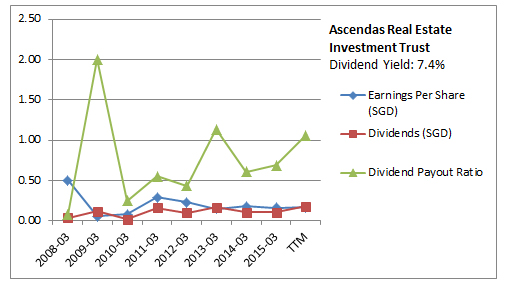
- Ascendas India Trust (Latest payout ratio: 1.06)
- CapitaLand Mall Trust (Latest payout ratio: 0.65)
- Fortune Real Estate Investment Trust (Latest payout ratio: 0.33)
- Suntec Real Estate Investment Trust (Latest payout ratio: 0.69)
- SATS Ltd (Latest payout ratio: 0.70)
- SIA Engineering Co Ltd (Latest payout ratio: 0.65)
- Singapore Post Ltd (Latest payout ratio: 0.88)
- Singapore Press Holdings Ltd (Latest payout ratio: 0.79)
- Singapore Technologies Engineering Ltd (Latest payout ratio: 0.29)
- Vicom Ltd (Latest payout ratio: 0.59)
- Venture Corp Ltd (Latest payout ratio: 0.88)
- M1 Ltd (Latest payout ratio: 1.00)
- Singapore Telecommunications Ltd (Latest payout ratio: 0.75)
- StarHub Ltd (Latest payout ratio: 0.87)
Out of these, only CapitaLand Commercial Trust (Dividend Yield: 5.5%), Fortune Real Estate Investment Trust (Dividend Yield: 5.6%), Singapore Technologies Engineering Ltd (Dividend Yield: 5.1%) and Vicom Ltd (Dividend Yield: 4.5%) stand out with their low dividend payout ratio.
They may not have very high yield, but they have consistent / decreasing / gradual increasing dividend payouts and low payout ratio.
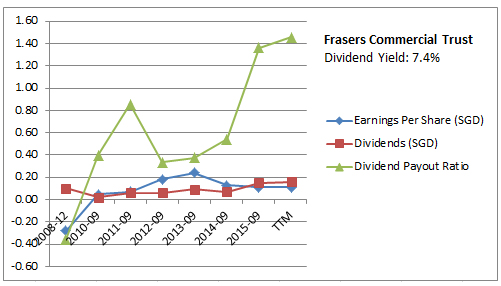
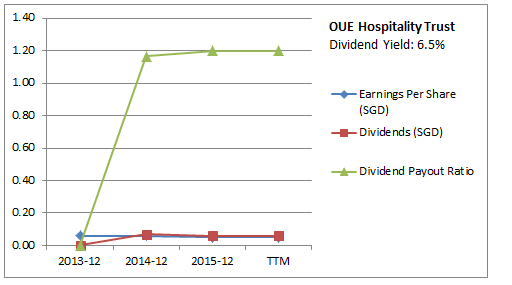
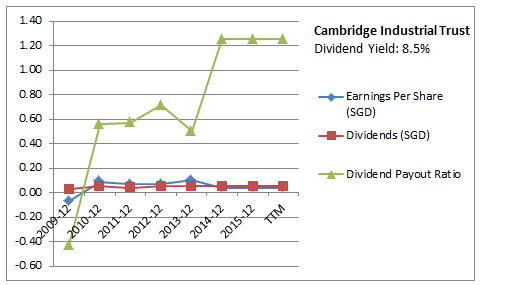
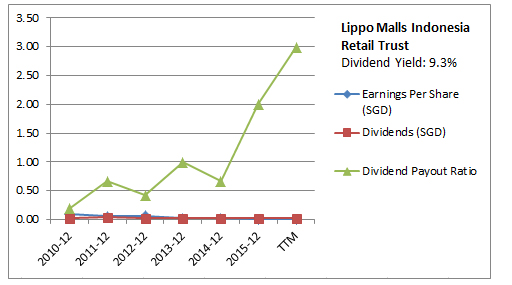
On the other hand, there are a few stocks with high increasing dividend payout ratios … some seems to be shooting high up vertically. To me, this seems like a big red flag.
- Frasers Commercial Trust (Latest payout ratio: 1.45)
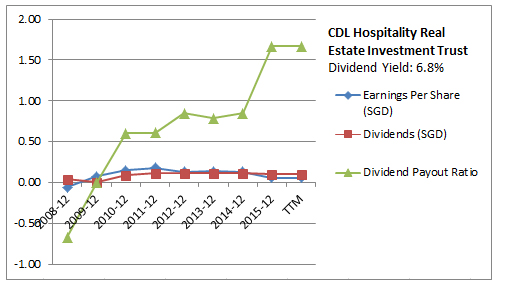
- CDL Hospitality Real Estate Investment Trust (Latest payout ratio: 1.67)
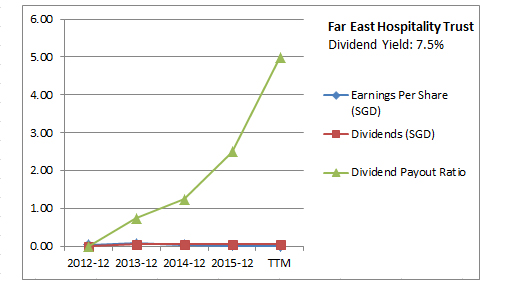
- Far East Hospitality Trust (Latest payout ratio: 5.00!)
- OUE Hospitality Trust (Latest payout ratio: 1.20)
- AIMS AMP Capital Industrial REIT (Latest payout ratio: 1.10)
- Cambridge Industrial Trust (Latest payout ratio: 1.25)
- Lippo Malls Indonesia Retail Trust (Latest payout ratio: 3.00!)

Ok, I received quite a no. of comments after I posted this article.
Firstly, I was informed by B (from A Path to Forever Financial Freedom blog) that the dividend figures do not include the interim or special dividend (so it is not the final total yearly dividend). In addition, for REITs, they are paying dividends out of cashflow so the EPS should not be used because most of it contained revaluation which cannot be distributed via dividends. I reckon free cash flow per share would be more appropriate.
Just wish there is a website or platform whereI can obtain all these final total dividend figures….
Yup, the study is not entirely accurate… thanks for highlighting.
Having said that, although the study is not accurate but it does give me a sense of those stocks which have increasing payout ratio, dividend growth, etc.. I reckon the trend should be similar considering the various factors.. it would perhaps lead me to further evaluate those few stocks with better payout ratio trend etc just to ensure that these are indeed great Singapore listed dividend stocks.
Shall leave you with this song.


Good job!
LikeLike
Thank you.
LikeLike
One thought on the analysis on REITs. It would be more appropriate to look at their Net Property Income or Income available for distribution as they are the amount of rent collected, from which payout in the forms of distributions are made. Looking at earnings is not so appropriate as they would include property revaluations which distorts the analysis.
LikeLike
I thought dividend is not applicable for REITs but rather, distribution from rental income.
Correct me if I am wrong.
Thanks
LikeLike
I reckon distribution per unit (in the case of REIT) is the same for dividend per unit. Read here.
LikeLike
For the REITs, the EPS probably contains some revaluation gain, which makes the payout ratio seem more conservative than it really is.
LikeLike
Hi
I think there may be some misalignment in the numbers. Reits for instance, has a payout ratio of 90% or more, but how did you get payout ratio of 0.36 for cct?
Vicom also has a payout ratio of 89%, again your numbers looks smaller.
Just curious 🙂
LikeLike
Ah, looked at it in more detail.
For reits, they are paying dividends out of cashflow so you cant take the eps because most of it contained revaluation which cannot be distributed via dividends.
Also for Vicom, you are only taking the final dividend but miss the interim dividend.
LikeLiked by 1 person
Thanks. Actually I saw your posts on Vicom. Am curious as where and how you obtain your payout ratio (eg. 79%)…(did ask a question in your post .. no reply)
So in the case of REITs, if I can’t use the EPS, then what figures should I use?
LikeLiked by 1 person
Hi Apenquotes
I think you missed out those special dividends portion, the same goes to STEng. Even though they are rightfully a special dividend, but some companies have been pretty steady in paying out the special dividends for as long as they are listed so they are not really one off.
For reits, dividends are distributed out of cashflow, or distributionsl income rather than earnings.
LikeLike
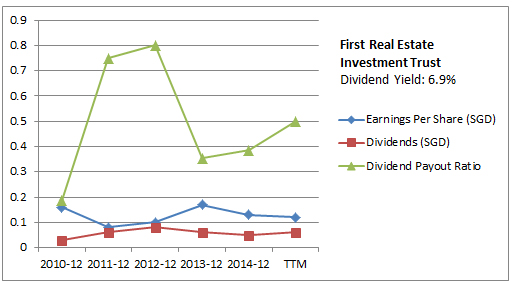
So in the case of First REITS, looking at the data in Morningstar, for the year 2014-12, the dividend was 0.05, free cash flow per share was 0.10.
So the Dividend payout ratio would be 0.05/0.1 = 0.5.
Well, this is just a study. I hope there is a platform whereby I can obtain all the final total dividend (final + interim). Given the large no. of stocks – a lot of time would be needed to calculate the total final dividend.
Agree that the study is not accurate, but it does give a feel of the past trend and growth.
Thanks for highlighting!
LikeLike
I usually exclude special dividends in my calculation for dividend payout ratio. The reason is companies do not pay out special dividends every time although some like ST engineering does.
LikeLike
Thank you for sharing such a list!
For ST eng, their ordinary dividend from 2011 to 2013 was 7 cents, 2014 – 8 cents and 2015 – 10 cents. Excluding special.
Fyi
LikeLike
You are welcome. Thanks for highlighting.
LikeLike
i like this post of yours… give quite a good overall picture..
anway, i blog about this website, it was quite useful for me… not sure if it helps your cause. for finding out the dividends.
not sure if you can choose “clickable thumbnail” for the graphs.
dang, the small graphs and fonts are killing my eyes..
LikeLike
Thank you. Will check out the website.
I did the charts in a single jpeg… so can’t really do a clickable thumbnail. Suggest you download the jpeg on a laptop or PC than zoom in.
LikeLike
Went back to look at this post of mine. Realised that the charts jpeg is really very blur. So upload all the individual charts. Thanks for highlighting.
LikeLike
Pingback: Singapore Technologies Engineering Ltd (Time to buy?) | A Pen Quotes
Pingback: Singapore Technologies Engineering Ltd (Time to buy?)